Michael is a PhD candidate at UC Berkeley studying physical and materials chemis
11 stories
·
1 follower

Millennials, Mobility, and Multi-Modality

1 Share

Lucian Go, Program Assistant, Transportation, San Francisco

It no longer takes a transportation planner to see the shift occurring in the travel habits of the millennial generation, which is the largest and most diverse in American history. We’re driving less, walking and biking more, and gravitating towards more vibrant and compact communities that facilitate car-free lifestyles. In doing so, millennials are helping push American transportation preferences in a new direction.

Two new reports released today by APTA and U.S. PIRG dig deeper into this trend.  APTA’s report, entitled Millennials & Mobility: Understanding the Millennial Mindset, found through polling that millennials are increasingly multi-modal, with 69% of respondents using multiple transportation options to reach a destination a few times a week or more. The report found that on average, three different transportation options are used on a typical trip (this includes walking), mainly due to the lower cost and convenience of traveling this way.

In essence, this polling demonstrates the potential behind the mobility hubs and technology-enabled transportation services that I’ve blogged about previously. Millennials aren’t wedded to using a single mode to get where they’re going, and the polling shows that they would like to see real-time updates, a more-user friendly experience, and amenities like Wi-Fi to allow them to travel the way a lot of them probably live: spontaneously.

What can cities and planning agencies do to further this trend away from car dependence and the pollution and congestion associated with it? As U.S. PIRG’s new report A New Way to Go highlights, quite a lot. 

The report recognizes that outdated, mode-specific “silos” within transportation agencies can present barriers to technology-enabled transportation services. By modernizing regulations to embrace multi-modality, transportation planners can help to spread more and better transportation choices to Americans, whether they live in cities or suburbs.

For more details, see the full APTA and U.S. PIRG reports.

Read the whole story
therealmichaelmoore
4069 days ago
reply
Share this story
Delete

Record-Breaking Fuel Efficiency Beats Expectations

1 Share

Roland Hwang, Transportation Program Director, San Francisco

With August setting another record for fuel efficiency, the auto industry is ahead of regulator's original expectation for model year 2013. The auto industry is clearly on track to meet the 2016 fuel economy standards and the longer-term, 2025 target to double fuel efficiency to 54.5 mpg. Year-to-date fuel economy of 24.7 mpg easily beats the regulator's original prediction that the standards would result in of 23.8 mpg.

According to research by Michael Sivak and Brandon Schoettle of theUniversity of Michigan, the average window sticker or label value in August hit new high of 24.9 mpg, up 1.2 mpg from the same month last year and an uptick of 0.1 mpg from July. The year-to-date level of 24.7 mpg will likely be similar to the final level for model year 2013 since the new model year starts in October. The unadjusted or certification fuel economy values for new auto sales, show a similar trend.

Fuel Economy Trends Aug 13.png

When regulators finalized the current round of standards for model years 2012-16 in 2010, they set a standard equivalent to 30.5 mpg for model year 2013 when tested on the certification test cycle. When adjusted for the gap between certification test cycle and window sticker values and the use of credits, regulators estimated the new standard would result in a 2013 window sticker value that is equivalent to 23.8 mpg. This is 0.9 mpg lower than the 24.7 mpg year-to-date actual fuel economy level.

The 23.8 mpg is based on the regulator's estimate of an “achieved” certification test level of 29.7 mpg for model year 2013. Assuming a 20% gap, I estimate the expected average window sticker level to be 23.8 mpg. Regulators cannot predict the exact fuel economy level because of program flexibilities. Ratio of cars to light trucks sales, the average size of vehicles sold, the use of flex fuel and over credits, all will impact the fleet fuel economy levels actually achieved.

High gas prices and increased fuel economy standards has unleashed tremendous innovation in the auto industry. More attractive fuel-efficient offerings across their lineup helped boost auto sales to their highest levels in past seven years. Greater innovation and means a healthier, more competitive auto industry.

Read the whole story
therealmichaelmoore
4069 days ago
reply
Share this story
Delete

New Study Finds 2012's Extreme Weather Linked to Climate Change

1 Share

Rob Moore, Senior Policy Analyst, Chicago

Climate scientists are usually quick to point out that it is exceedingly difficult to link a specific weather event to climate change.  Now, a new major study finds a distinct connection between man-made rapidly warming climate and a handful of identifiable extreme weather events in 2012.

This is important news. It marks one of the first times scientists have connected the dots. Just a year ago, the National Oceanic and Atmospheric Administration issued its first version of this study and concluded:

“In the past it was often stated that it simply was not possible to make an attribution statement about an individual weather or climate event. However, scientific thinking on this issue has moved on and now it is widely accepted that attribu­tion statements about individual weather or climate events are possible, provided proper account is taken of the probabilistic nature of attribution (Nature Publishing Group 2011).”

This year’s NOAA study moves the ball forward. It acknowledges that while the study may not be comprehensive, its findings are compelling.

“So, there is a danger in drawing too strong a conclusion from a small sample of 19 analyses of 12 events that were not chosen at random. That said, approximately half of the analyses found some evidence that anthropogenic climate change was a contributing factor to the extreme event examined, though the effects of natural fluctuations of weather and climate on the evolution of many of the extreme events played key roles as well.”

The NOAA report released yesterday compiles 19 analyses conducted by 18 different teams of scientists who looked at 12 extreme weather events around the world. In about half of the cases the scientific teams concluded that climate change impacts contributed to the severity of the extreme weather event in question.  The findings by the teams were compiled and edited by scientists at NOAA and the U.K. Meteorological Office, and the paper was published in the September edition of the Bulletin of the American Meteorological Society.

Even in the studies that did not find a strong link to climate change as a cause for the event, the authors did not rule out a climate link.  In the case of the drought that struck the Midwest last year, one team of researchers found it was difficult to attribute the very low level of precipitation to climate change, but another team did show that the extreme heat seen in July 2012 is already four times more likely to happen than in the past because of climate change. Higher temperatures mean more rapid evaporation of soil moisture, suggesting climate change is increasing the region’s risk to drought.

Similarly, in the case of Hurricane Sandy, researchers found it difficult to conclude that climate change caused that individual storm, but their findings show an alarming future.  The odds of a Sandy-like disaster occurring in the New York City area again have increased by about 50 percent since 1950 and will increase even more dramatically by the end of this century.   

What they found should make anybody in the area from Connecticut, New York, and New Jersey very nervous.  By the year 2100 a level of flooding and storm surge similar to Sandy can be expected to strike the Battery in Lower Manhattan as frequently as every 20-50 years, assuming a sea level rise of 0.5m – 1.2m.  Under the worst case scenario of sea level rise of 2.0m, a Sandy-like flooding and storm surge event will happen every year or two by 2100.

The results of these studies are particularly troubling when one considers that global average temperatures have only increased by 1.3 degrees Fahrenheit.  By the end of this century, temperatures are projected to increase by another 2 degrees — or by 10 degrees or more if we do not immediately begin to curb emissions of heat-trapping pollution.

The report shows that scientists can discern climate’s influence on specific extreme weather events. Even where the relationship between climate change and a specific event are unclear, scientists are often able to determine that there is a greatly increased likelihood of a similarly destructive event in the future.  Clearly climate change is having an impact on extreme weather and we are going to be feeling that impact far more frequently. 


See below for more coverage of this report’s release.

AP:  Study Links Warming to Some 2012 Wild Weather

Washington Post: Major NOAA report: Climate change intensified 2012 record heat in U.S.

Huffington Post:  NOAA: Sandy-Like Flooding Now Twice As Likely Due to Climate Change

New York Times: Research Cites Role of Warming in Extremes

USA Today:  Climate change to bring more sizzling summers, study says

The Guardian:  Study says climate change exacerbated half of recent extreme weather events

Read the whole story
therealmichaelmoore
4069 days ago
reply
Share this story
Delete

'Green' sprawl is still sprawl

1 Share

Kaid Benfield, Director, Sustainable Communities, Washington, DC
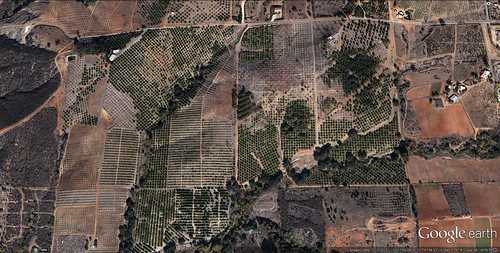
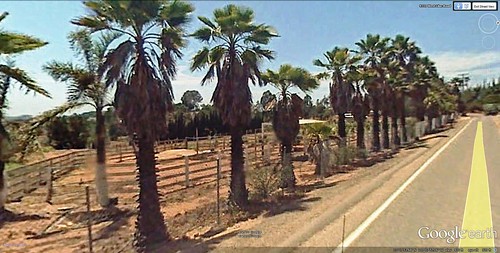
part of the site for proposed Lilac Hills Ranch (via Google Earth)

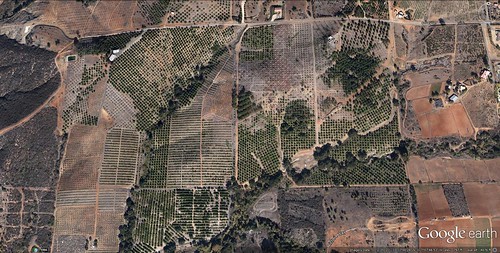
part of the site for proposed Lilac Hills Ranch (via Google Earth)

Does the lead photo with this article look like a good place to put over 1700 new homes on a little over 600 acres? What if I told you it was working agricultural land in a remote location 45 miles north of San Diego and 61 miles south of San Bernardino, California? What if I added that the developer is doing everything it can to make the project green? Those are the questions currently facing San Diego County authorities.

The environmental importance of development location

Unfortunately for the proposed project’s sponsor, the most significant factor in determining the environmental impacts of real estate development is the project’s location. Even the greenest development in the wrong location will create more environmental problems than it will solve. Of course, that doesn’t stop developers’ and architects’ green puffery. Heck, they may even be well-intentioned, trying to do the greenest internal design on a site whose non-green location cannot be overcome. But trying to green a project doesn’t make wishes come true.

I’ve written about this sort of thing multiple times, criticizing a purported “net zero” energy-efficient development in Illinoisthat is totally automobile-dependent, and pointing out that higher density, though generally an asset to green performance, won’t cure locational problems. I’ve criticized the American Institute of Architects and even the US Green Building Council for undervaluing location in their green awards programs. (At least USGBC has taken a major positive step by adopting LEED for Neighborhood Development, a certification program that rewards good locations along with other green features. More about LEED-ND later in this article.)

Development locations far from existing cities and towns cause substantial environmental problems, disrupting agricultural lands and natural ecosystems; requiring the spread of resource-consuming infrastructure, including new road capacity that brings more runoff-causing pavement to watersheds; attracting ancillary sprawling development nearby; and causing major transportation impacts.

I can’t over-stress that last point: On average, we use more energy and emit more carbon getting to and from a building than does the building itself. Peer-reviewed research published by the federal EPA shows that even green homes in conventional suburban locations use more energy and emit more carbon that non-green homes in transit-served city neighborhoods. The problem only gets worse when the development is located beyond suburbia on truly rural land. Indeed, the most exhaustive research I know on how land use affects travel behavior found that location – measured by, among other things, the distance from the regional center – is by far the most significant determinant of how much household driving will occur, over time, from a given location.

Simply put, green sprawl is still sprawl.

“An I-15 sustainable community”

This brings me to a proposed “I-15 sustainable community” (the developer’s tagline) on the northern edge some 45 miles north of San Diego County, and 61 miles south of San Bernardino, California. I’m tempted to say that the site is in the middle of nowhere, but that’s not quite fair. It is more accurate to say that it is decidedly rural, home to working orchards, cropland and ranchland on rolling terrain near Lancaster, Pala, and Weaver Mountains. Mountains near the north edge of San Diego County. There are scattered rural residential enclaves and a few small, newer suburban developments within a few miles.
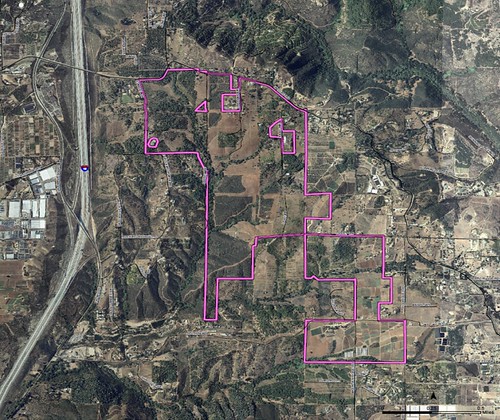
the project's boundary and context (courtesy of San Diego County, Draft Environmental Impact Report)

view of the site from West Valley Road (via Google Earth)

The proposal’s draft environmental impact report describes the setting this way:

“The project site is generally characterized by agricultural lands and gently rolling knolls, with steeper hillsides and ridges running north and south along the western edge. Existing land uses in the surrounding area include residential dwellings that range from suburban to semi-rural densities, along with agricultural uses and vacant lands.”

What the site is not is a good place to put 1,746 new homes at an average density of 2.9 units per acre.

Perhaps that is why it is illegal under current law, which zones the land for agricultural use. That is also its designation in the county’s general plan, recently adopted after more than a decade of deliberation. The developer is seeking to change the zoning and to change the plan to accommodate the development.

The developer’s argument for the proposal, to be called Lilac Hills Ranch, is that it will be internally walkable, with amenities within a 10-minute reach of most residents; that it will cluster development so as to maintain green space; that it will utilize green technology in building design; and that it will create “a neighborhood grounded in traditional small-town values embracing 21st Century design and sustainability.”

To be honest, that sounds pretty nice if it were located adjacent to existing development instead of leapfrogging across vacant land. But it isn’t; I took a look at some numbers. Because the site is unusually shaped and mostly open land, it is hard to find a point within it that is catalogued in searchable databases. So I picked a spot on the north edge of the site on West Valley Road, the main access to the site from I-15, and ran it through some calculators.

Location by the numbers

Google Maps says the north side of the project is 14 miles from San Marcos, the nearest town with significant employment, 16 miles from downtown Escondido, and 22 miles from Rancho Bernardo. As noted, it is 45 miles from downtown San Diego. We’re talking about very long work commutes. There is no transit nearby and, even under the best of circumstances, unlikely to be any future transit that would go conveniently from the development to San Diego County’s scattered work sites.
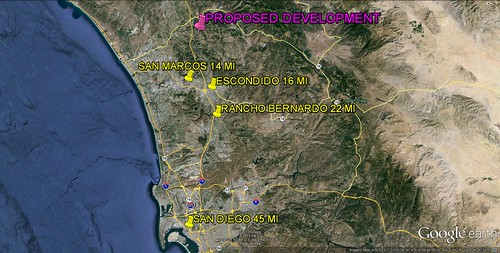
project location (via Google Earth)

My spot’s Walk Score was 2. Pretty low, eh? Walk Score basically measures how close a site is to shops and conveniences. Ideally, it finds walkable locations with ratings above 60 or so that have things within walking distance. The average Walk Score Sore for Escondido is 51. For San Diego city, the average Walk Score is 56. The average in Los Angeles is 66. A Walk Score of 2 means that this site is not near much, to say the least.

I also ran it through the Abogo calculator maintained by the Center for Neighborhood Technology, which displays driving rates and costs, along with emissions data, for given locations. The average household in the general vicinity of the proposed development emits 1.02 metric tons of carbon dioxide each month just from transportation. This is 46 percent above that of the San Diego region as a whole.

The developer apparently wishes believes that Lilac Hills Ranch would actually reduce greenhouse gas emissions by up to 40 percent compared to a “business-as-usual” scenario, mostly because of the project’s internal walkability and planned commercial spaces that would absorb trips that otherwise would be made outside the project. Nothing in the literature of transportation research suggests that would be the case.

First, let’s parse what “business as usual” means. What the developer is really claiming is that the project would reduce emissions compared to an even more sprawling development in the same location. The developer is not claiming, nor could it, that the project would reduce emissions below the average for the metropolitan region or even below the amount that would be experienced in an alternative site closer to Escondido or San Diego. As noted above, the most exhaustive research on the subject (Professors Ewing and Cervero’s epic “Travel and the Built Environment,” published in the Journal of the American Planning Association) found that proximity to downtown and other major destinations, not internal design, was the most significant factor in determining driving rates. (“Almost any development in a central location is likely to generate less automobile travel than the best-designed, compact, mixed-use development in a remote location,” write the scholars.)

Look, this proposal basically would replace working agricultural land with a commuter suburb, albeit with some very nice internal amenities for its residents.
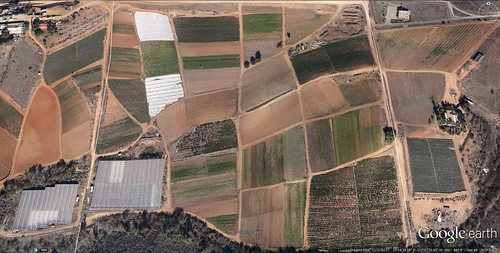
more of the project site (via Google Earth)

Dan Silver, MD, executive director of the Endangered Habitats League, summed the League’s position in a letter to the San Diego County planning office, which is apparently reviewing the proposal:

“This project would create a commuter-based ‘bedroom’ community in an agricultural portion of Valley Center. It would shred the consensus reached for the Valley Center community as part of the historic General Plan Update, just adopted in 2011. No compelling planning rationale or deficit in housing capacity is present to justify this proposed amendment.”

The League is not alone in its criticisms. The Valley Center Planning Group voted 11-1 to send a scathing critique of the proposal to the planning office, according to an article by David Ross published last month on the local news site Valley Road Runner. If anything, the Planning Group’s language was even stronger than that of the Endangered Habitats League, reports Ross:

“Key take-aways from the response the Planning Group approved Monday night:

• “The project is leapfrogging leapfroging and therefore contrary to the good planning principles upon which the General Plan Update was based. It plops urban building densities into a rural agricultural area without appropriate existing infrastructure.A much better project alternative than any proposed is within the Downtown Escondido Specific Plan Area, says the review.

• “In most major areas of the project, the rationale presented by the applicant is going to change the General Plan requirements to be aligned with what it wants to do. According to the group, this defeats the efforts by all who participated in the 12-year-long, $18 million county General Plan Update project that was approved by the Board of Supervisors only two years ago.”

It seems to me that the planning office should be encouraging green revitalization and redevelopment within cities and towns, and encouraging the addition of new green features to existing suburbs. In some cases, it might be reasonable to review even a new mega-project such as this one if it were not only green but also adjacent and connected to existing development. But, assuming the worst, what’s the point of having a planning office if it approves leapfrog development that violates its own plan?

The project, LEED-ND, and California planning law

Adding rhetorical insult to environmental injury, a document prepared in support of the development asserts that the proposal is “designed to meet the environmental standards of” LEED for Neighborhood Development, the voluntary green rating system mentioned at the top of this article. (See our Citizen’s Guide.) Seriously? Then file an application and get a certification that proves it. Heck, you could at least apply to the US Green Building Council, which administers LEED-ND, for a “prerequisite review” that for a fraction of the cost and time of full certification will determine whether you meet the rock-bottom minimum locational standards of the system.

Given the serious doubts raised about this proposal, if I were a planning official for San Diego County I would politely ask that the developer do just that as a condition of further discussion of any zoning change or planning amendment. Speaking for myself, my informal opinion based on about a dozen painful hours of reviewing planning documents in this case is that there is not a snowball’s chance in hell that this proposal qualifies for LEED-ND certification or even that it would pass the minimum prerequisites to be considered.

For one thing, LEED-ND requires a minimum average density of seven dwellings per acre, not the 2.9 at issue here. For another, the LEED-ND locational prerequisite is generous, but not generous enough to let this project slip through. (I should know, because I was its principal author.) To be considered, a project must qualify as (1) infill; (2) adjacent and connected to a minimum amount of previous development; (3) served by existing or fully committed minimum transit service; or (4) surrounded by a minimum number of specified, pre-existing “neighborhood assets” within walking distance. In other words, a project can’t be smack in the middle of rural land at a long distance from existing development. Well, it can be, but it won’t – and shouldn’t – qualify for green certification under LEED-ND.
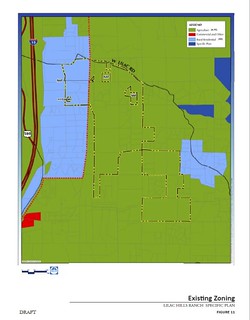
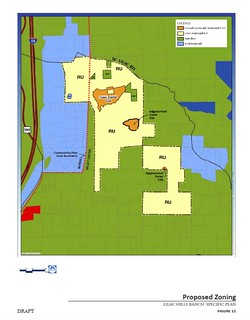
current zoning is agricultural (via draft Lilac Hills Ranch specific plan)proposed zoning change ro "residential urban" (via draft Lilac Hills Ranch Specific Plan)

Current agricultural zoning (left) and proposed change to "residential urban" (right)

Finally, in 2008 California passed what many of us believed at the time to be landmark legislation (“SB 375”) requiring that each metropolitan area in the state, including San Diego County, develop specific, long-range land use and transportation planning documents that meet assigned targets for reducing emissions of greenhouse gases from transportation. A lot of people in the state, including my NRDC colleague Amanda Eaken, worked long and hard to ensure that the new law would be fair to developers and municipalities as well as protective of the environment. They succeeded at that, and won the support of a broad range of nonprofit and commercial interests.

Basically, each metro area must develop a “Sustainable Communities Strategy” as part of its transportation plan. The SCS must anticipate population growth and housing needs and allocate them to areas within the region that can accept them consistent with the law’s environmental aims. The state’s Air Resources Board must review and certify that the plans are adequate to meet their emissions-reduction targets. Municipalities are expected to conform to the regional plans, and transportation funding and development approval benefits flow to the priority growth areas.

The whole point of SB375 was to encourage development within or close to existing development and existing city and town infrastructure. (And, no, contrary to the developer's assertions here, being close to an Interstate highway is not what the framers had in mind when they spoke of existing city and town infrastructure.)

The Sustainable Communities Strategy for San Diego County, crafted by the San Diego Association of Governments and adopted two years ago, was built on the premise that the county’s general land use plan would remain in place. As a result, this development not only challenges the plan; it also flies in the face of all the hard work and good faith that went into the region’s Sustainable Communities Strategy pursuant to SB375. This should matter, not just a little but a lot. As far as I could tell from the documents I reviewed, the SCS isn’t even mentioned.

The bottom line: in another place, this might be a great green development, though I would want to improve its design for better walkable density and transit access. Its on-site premises do appear to have some merit to them. But this location is so, so wrong that it negates what might otherwise be the development's environmental assets. It's a shame because, in the end, the development basically amounts to little more than pretty sprawl.

Related posts:

Move your cursor over the images for credit information.

Kaid Benfield writes about community, development, and the environment on Switchboard and in other national media. For more posts, see his blog's home page. Please also visit NRDC’s Sustainable Communities Video Channels.

Read the whole story
therealmichaelmoore
4069 days ago
reply
Share this story
Delete

New Warnings About Methane Emissions

1 Share

By Steven Hamburg

Concerns about the methane problem associated with the U.S. natural gas boom are mounting with each study released. This week scientists with the National Oceanic and Atmospheric Administration (NOAA) and the University of Colorado (UC) at Boulder published a new paper on methane leakage in the journal Geophysical Research Letters. It reports an alarmingly high level of methane emissions in the Uintah Basin of Utah — 6.2 to 11.7 percent of total production for an area about 1,000 square miles. Findings are based on readings from airplane flights that measured methane in the air on a single day and estimated the proportion of those emissions that came from the oil and gas infrastructure —production, gathering systems, processing and transmission of the gas out of the region. The authors calculated the uncertainty of their measurements, finding a 68 percent chance the leak rate is between 6.2 and 11.7 percent, and a 95 percent chance it is between 3.5 and 14 percent.

This follows two other regional studies conducted by scientists at the same organizations. One released last May in the Journal of Geophysical Research reported a 17 percent methane leak rate for the Los Angeles Basin, which has received quite a bit of attention although, as I’ll explain below, the figure can be misleading.  The second study, conducted over the Denver-Julesburg Basin in 2008, found 4 percent of the methane produced at an oil and gas field near Denver at that time was escaping into the atmosphere. Taken together, these studies are troubling. They should be regarded as alarm bells ringing in our ears. Action by policymakers and industry is needed now.

Any amount of methane lost from the natural gas supply chain should be eliminated whenever possible. That’s because methane retains heat much more effectively relative to carbon dioxide: Over the first 20 years, an ounce of methane traps in heat 72 times more efficient. Even small amounts vented or released as “fugitives” – unintentional methane leaked as gas moves from the field to your doorstep – can reduce or eliminate the climate advantage we think we’re getting when we substitute natural gas for coal or oil.

That said, in order to understand how to reduce the leaks we must recognize that each study offers a snapshot of emissions at a specific time, across a specific basin. Different industry sources make up the emissions profile in these areas, including distinct amounts of oil and gas production, and varying components of the natural gas supply chain (production, gathering, processing and local distribution).  By comparison, the latest estimates from the U.S. Environmental Protection Agency suggest that 1.5 percent of total U.S. natural gas production was lost to venting or leakage in 2011. We have a lot of work to do to understand the apparent disparities between different estimates and studies.

Though Environmental Defense Fund was not involved in any of these studies, we can offer some important context based on our own experience doing research on this critical issue.

Methane emissions can occur from natural gas produced both from oil and gas wells. In order to get a clear understanding of the problem, it is necessary to pay careful attention to the details of each study.  In the Los Angeles study, for example, the authors report a 17 percent leakage for the oil and gas industry, but fail to highlight that the vast majority of total hydrocarbon production in the basin is oil. This led some to the mistaken conclusion that 17 percent leakage applies to the natural gas industry as a whole.

Certainly, this finding still indicates more should be done to better control methane emissions associated with oil production in the Los Angeles Basin.  But it also points to a limitation with methane leak rates: Percentages quoted are not comparable between basins. Regional differences matter.

Further, oil and gas production in the Los Angeles Basin study only accounted for 8 percent of the region’s total methane emissions, compared to 48 percent from natural gas distribution and geologic seeps. The Los Angeles study underscores the importance of looking at the total picture when assessing sources and remedies of methane pollution.

The Uintah study is a slightly different story.  In this case, the basin is made up predominantly of natural gas producing wells, but the overflight captured more than just production activities.  Emissions from gathering, processing, and other various ancillary activities taking place in the basin were also captured in the overflight, with no way to attribute the high emissions among these various elements of the natural gas supply chain.

In other words, there is as of yet no data to tell us whether the emissions are coming from production, gathering, processing or other activities.  We know that industry-wide, the production process known as well completions (the process after hydraulic fracturing when a well is cleared of fluids and sands) may contribute about 10 percent of the total methane emissions if operators are not using “green completion” technologies that capture emissions for sales or beneficial reuse. Under recently enacted federal regulations, which EDF fought to adopt, green completions will be required nationally for any new hydraulically fractured natural gas well starting January 2015. There’s no data on whether operators in the Uintah were using green completions at the time of the study, but there is reason to suspect they were not. The Uintah study authors cite a U.S. Government Accountability Office report that notes higher rates of methane flaring and venting at the time of the study than in surrounding production basins.

More investigative work is needed before we can claim to understand what is driving these apparently large emissions. We don’t know everything we need to about the production and distribution practices employed in the Uintah Basin when this research took place, but there is no reason for the public to remain in the dark.  Producers, gathering and processing companies, and pipeline companies in the Uintah Basin must provide citizens with a clear accounting of what they were doing at the time these measurements were made, what they are currently doing and what they will do to end polluting practices and reduce methane pollution.  Likewise, federal and state regulators governing air rules in Utah need to take a hard look at their regulatory and enforcement practices, and provide evidence to assure the public that they are employing necessary procedures to prevent air pollution from the oil and gas infrastructure.  The evidence would suggest they are lagging. It appears there is a lot of work to do in Utah, and companies and regulators alike should not waste a moment in getting after it – including steps to routinely survey emissions in active basins to measure progress over time.

As to what these studies mean for our nation as a whole, one  need is additional data — a comprehensive and consistent look at methane emissions at various locations across the country — in order to properly characterize methane across the U.S. natural gas supply system. That’s why EDF, along with close to 100 academic, research and industry partners, is working on a series of 16 studies to directly measure methane emissions across the supply chain. Together, these sixteen studies will provide the most complete national picture of methane emissions to date.

The first study, led by the University of Texas and involving nine natural gas producers, will be published in the coming weeks. The UT study is not based on emissions from a single location but on measurements from diverse regions with data collected at the actual source. Direct measurements in the UT study focus on methane lost at the well pad and other natural gas production points, and will provide insights into how effectively specific industry practices can contain methane emissions. But it won’t offer a complete picture of methane emissions across all of the natural gas system. We’ll need the entire series of studies, a project that will continue through 2014, before we can draw comprehensive conclusions about the scope of the problem and the full range of options for minimizing methane emissions.

The Uintah and Los Angeles studies tell us that methane emissions appear to be a serious problem in some regions. Additional data will tell us more about where emissions are occurring and what can be done to reduce them.  But we know enough to get started fixing the problem. There is no reason to wait.

Read the whole story
therealmichaelmoore
4127 days ago
reply
Share this story
Delete

Achieving Deep Cuts in the Carbon Intensity of U.S. Automobile Transportation by 2050: Complementary Roles for Electricity and Biofuels

1 Share

TOC Graphic

Environmental Science & Technology
DOI: 10.1021/es4015635
Read the whole story
therealmichaelmoore
4130 days ago
reply
Share this story
Delete
Next Page of Stories